Construction Analytics
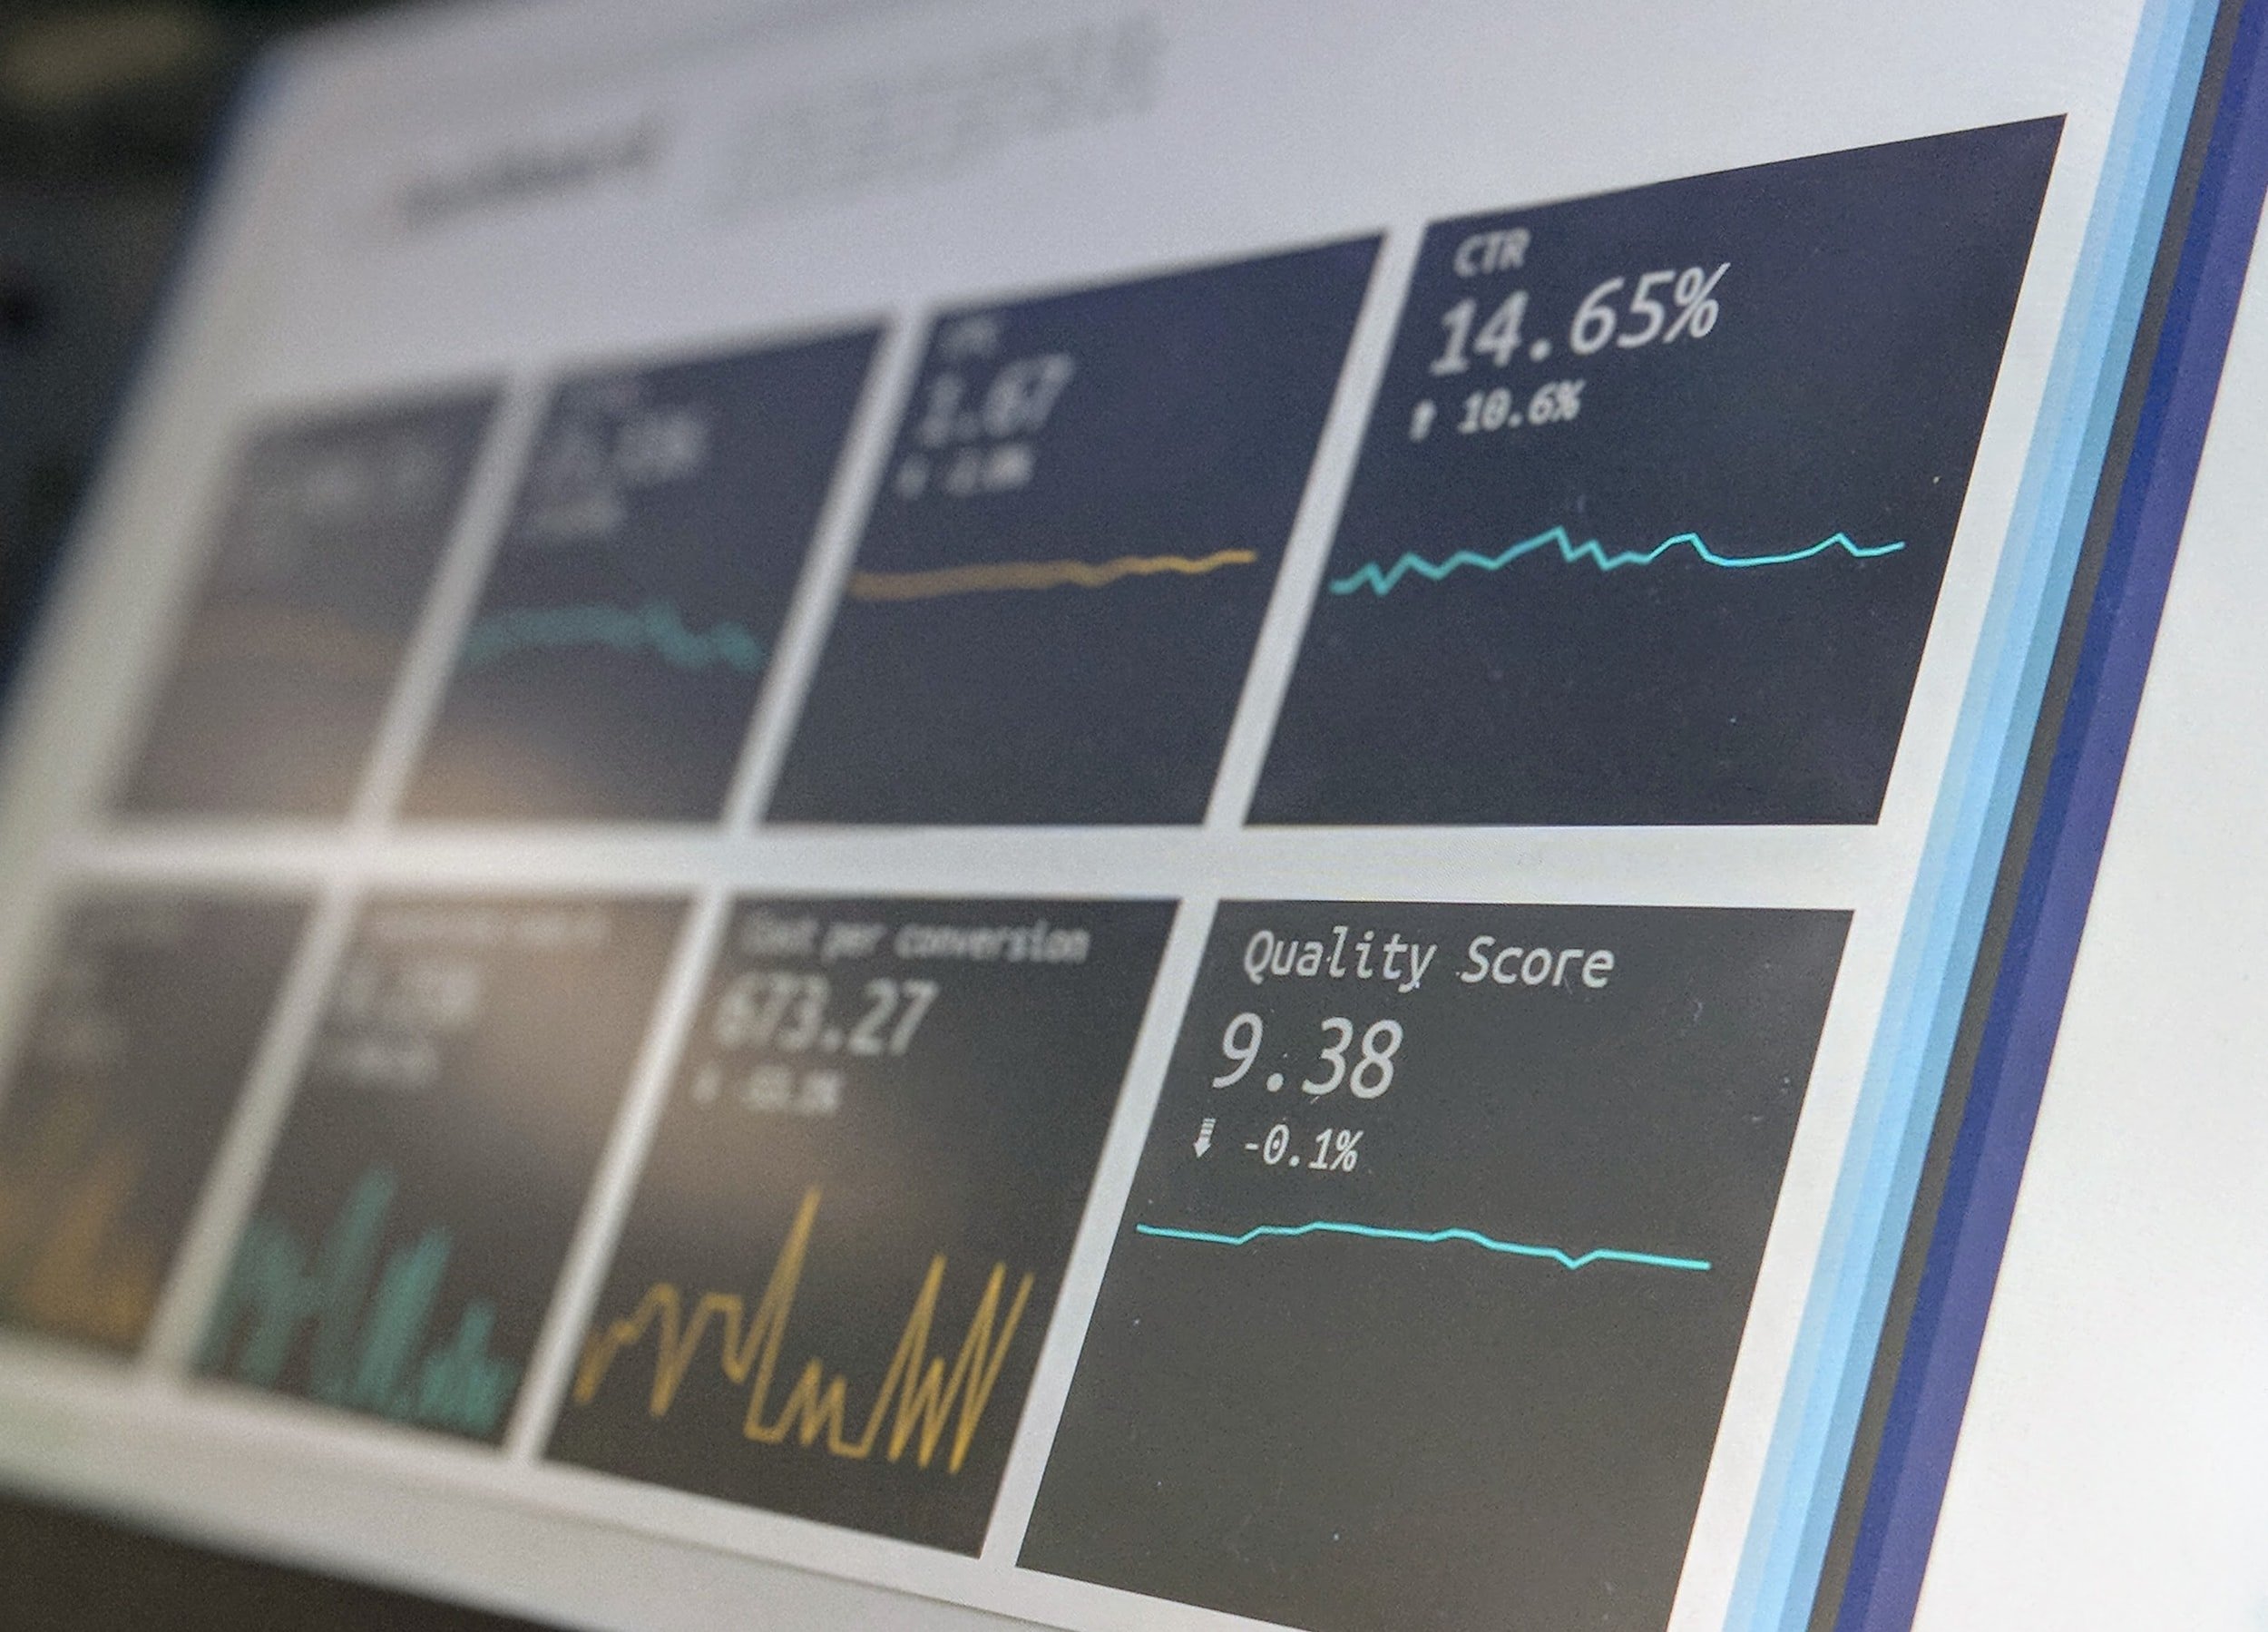
As construction technology improves exponentially—in the hands of your team members as well as through sensors on every piece of machinery—the amount of data available to the modern construction leader is overwhelming.

We help you convert big data into meaningful information and insights to drive better decision-making.
How? We collaborate with clients to collect, organize, and visualize data in a new way to better explain, predict, and ultimately change the behaviors of people on your team and on your job site.
BIG DATA Problems OUR CLIENTS experiencE
Owners and senior leaders reach out to us when they wish to:
better analyze and manage construction project costs
evaluate the relative performance of different managers with ROI rankings
reduce risk through improved understanding of safety lead measure data
visualize the impact of change order size and frequency on different projects
want to develop custom predictive models to forecast better
implement better compensation models that drive growth
develop cost-to-serve models to understand customer profitability
What we offer
We offer four levels of construction performance analytics that can be customized to your objectives:
LEVEL I
Team Member Focus
Level I is all about the individual team member, their contribution to overall profitability, and determining their individual Return On Investment (ROI) to your organization.
-
Goals
Kolbe default-to-work scores
Activities vs. Output
Impact on past projects
All-In Compensation
Commissions + FICA + Med + Life + LT Dis + 401(k) + Auto + Phone + Fuel + Training + Takeoffs
Teammate perception quantification
LEVEL II
Project Team Focus
Level II expands from the team member to their projects as we build custom metrics to evaluate team performance and constantly monitor project collaborations with suppliers, subs, and owners that impact performance and your reputation.
-
Employee retention
Project team engagement
Monitor team budgets
Supplier perception micro-surveys
Subcontractor perception micro-surveys
Owner perception micro-surveys
LEVEL III
Market Focus
Level III zooms out out to evaluate your organization's positioning—and your opportunities—in your market for the projects you are uniquely positioned to build on-time and under budget.
-
U.S. Census
Bureau of Labor Statistics
FRED Economic data
John Burns Real Estate Data
Case-Shiller Home Price Index
Dodge Reports
Consumer Sentiment Index
Construction per Zip Code
Local Permit Data
LEVEL IV
Team Communication Focus
Level IV zooms in to the micro view of your team—collecting and organizing internal team data to generate insights on overall effectiveness to drive behavior change.
-
Sales rep call frequency + duration
Text messaging
Email scraping
Cell phone mobility data
Website analytics

Our unique approach
We start every analytics engagement understanding the questions that need to be answered, why those questions are important, and the desired outcomes our clients are looking for. From there, we make it easy to collect, organize, and analyze your data in order to convert construction data complexity into clarity that drives better decision-making with comprehensive reporting, custom dashboards, and custom apps built to your unique specifications.

Let’s collaborate.
If interested in collaborating, contact our team here and share your specific goals, outcomes, challenges, and any questions that you have top of mind. That will help us determine if we're a fit for a potential sales performance analytics engagement.
Terms to Know
Artificial Intelligence (AI)
Software systems that make decisions which typically require human expertise and understanding.
Interpretive analytics
Analysis that interprets, informs, or explains the data.
Predictive analytics
Analysis that predicts future results with a defined confidence interval.
Analytics
Systematic computational analysis of data and statistics used to discover, interpret, and communicate meaningful
patterns to drive better decision-making.
Machine Learning
Application of AI that enables systems to automatically learn and improve from experience without being explicitly programmed; e.g., programs that access data and use it to learn for themselves.
Market Inefficiency
Market participants make decisions based on incomplete information or faulty assumptions which results in systematically paying more—or less—for performance than it is worth.


